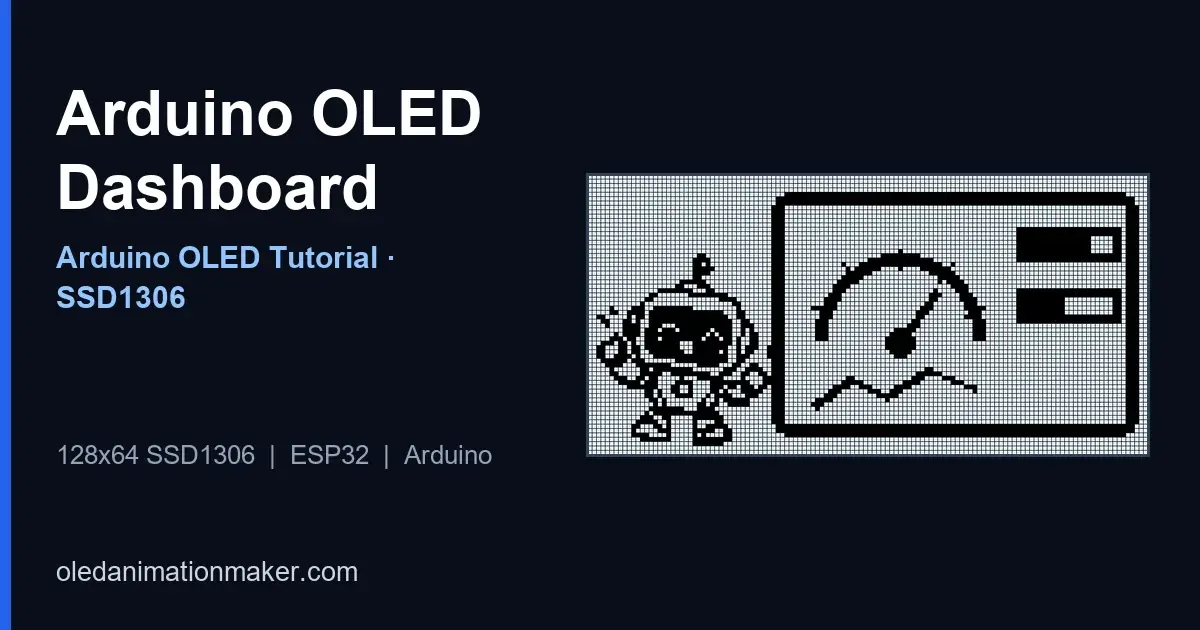
People expect a dashboard when they see an OLED on a robot or weather box: numbers that update, a bar that fills, maybe a needle gauge. You don't need bitmaps for this. Adafruit GFX primitives (lines, rectangles, circles) are enough, and they cost almost no flash next to animation frames.
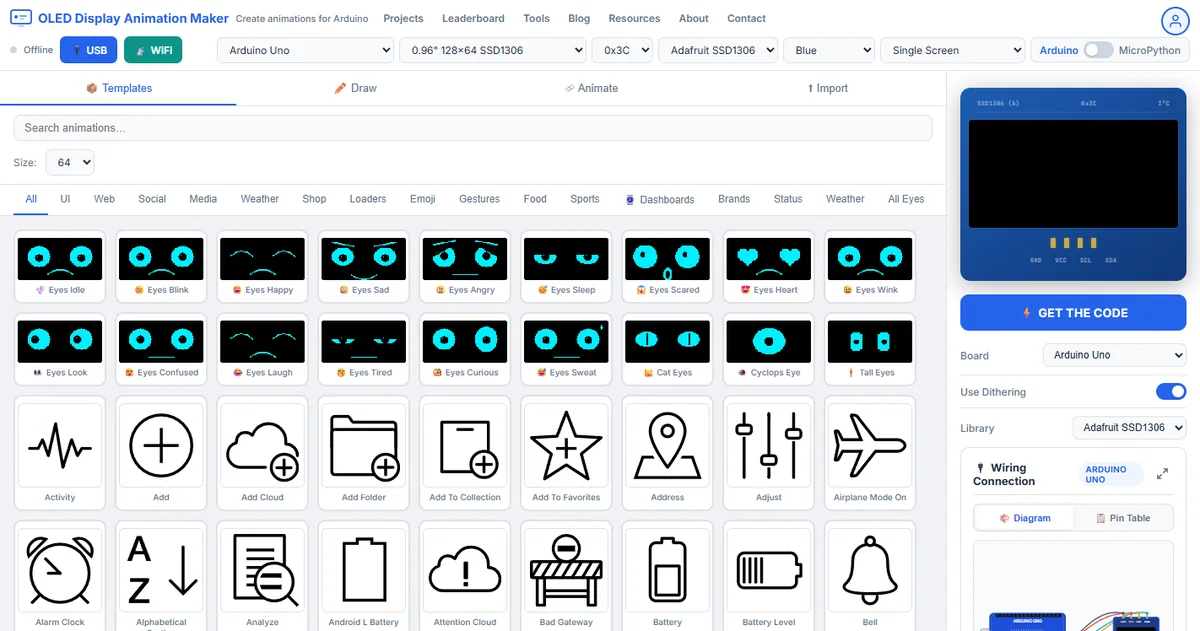
Here's the toolkit I reuse: a layout grid, a progress bar helper, a simple gauge, a redraw that doesn't thrash, using
millis(), and a full example that fakes two sensors, so you can run it with zero extra hardware.
Design rules I follow for 128×64
- 8×8 font: you get 21 characters wide × 8 rows, but leave margins or your screen looks cramped.
- One job per region. I put the title on top, values in the middle and bars at the bottom.
- Don't clear and redraw 1000 times a second. Update at 5-15 Hz unless something changed.
- Prefer integer math on an Uno. Floats are fine for demos, but you'll feel them in tight loops.
- Invert sparingly. A filled bar reads clearer than fancy anti-aliasing, which you can't afford anyway.
Layout sketch (coordinates)
// 128 x 64 canvas mental map
// y=0..9    title strip
// y=12..38  big numbers / gauge
// y=42..62  bars or status line
You can draw the title once into a static layout, or redraw everything each tick. At 10 Hz both are fine.
The expensive part is the display() I2C transfer. A few GFX calls aren't what slows you down.
Progress bar helper
void drawBar(Adafruit_SSD1306 &d, int x, int y, int w, int h, int value, int maxV) {
  if (maxV < 1) maxV = 1;
  if (value < 0) value = 0;
  if (value > maxV) value = maxV;
  d.drawRect(x, y, w, h, SSD1306_WHITE);
  int inner = w - 4;
  int fill = (int)((long)value * inner / maxV);
  if (fill > 0) {
    d.fillRect(x + 2, y + 2, fill, h - 4, SSD1306_WHITE);
  }
}
Here's how you call it: drawBar(display, 0, 50, 128, 10, humidity, 100);. A value of 0-100 maps to the width.
Simple needle gauge (arc-ish with lines)
True arcs are awkward in GFX. When I teach this, a semicircle outline plus a needle line is enough:
void drawGauge(Adafruit_SSD1306 &d, int cx, int cy, int r, int value, int maxV) {
  // outline
  d.drawCircle(cx, cy, r, SSD1306_WHITE);
  d.fillCircle(cx, cy, r - 8, SSD1306_BLACK); // hollow look
  d.drawCircle(cx, cy, r - 8, SSD1306_WHITE);

  // map value to angle 180°..0° (left to right)
  float t = (float)value / (float)maxV;      // 0..1
  float ang = 3.14159265f * (1.0f - t);      // pi .. 0
  int x2 = cx + (int)((r - 10) * cos(ang));
  int y2 = cy - (int)((r - 10) * sin(ang));
  d.drawLine(cx, cy, x2, y2, SSD1306_WHITE);
  d.fillCircle(cx, cy, 2, SSD1306_WHITE);
}
You'll need #include <math.h>. On an Uno, calling this at 50 Hz with floats is still fine for one gauge.
How you avoid flicker
- First, build your whole frame in the buffer (
clearDisplay→ draw all → onedisplay()). - Don't call
display()after every single line. It's the usual cause of flicker. - Gate updates:
if (millis() - last >= 100) { redraw(); last = millis(); } - If only a number changes, you can clear a small rect and redraw just that region. It's an optional optimization.
Full dashboard sketch (simulated sensors)
You don't need extra sensors. The sketch makes up "temperature" and "load" so you can study the UI. Swap in
analogRead or DHT code when you're ready.
#include <Wire.h>
#include <Adafruit_GFX.h>
#include <Adafruit_SSD1306.h>
#include <math.h>

Adafruit_SSD1306 display(128, 64, &Wire, -1);

void drawBar(int x, int y, int w, int h, int value, int maxV) {
  if (maxV < 1) maxV = 1;
  value = constrain(value, 0, maxV);
  display.drawRect(x, y, w, h, SSD1306_WHITE);
  int fill = (int)((long)value * (w - 4) / maxV);
  if (fill > 0) display.fillRect(x + 2, y + 2, fill, h - 4, SSD1306_WHITE);
}

void drawGauge(int cx, int cy, int r, int value, int maxV) {
  display.drawCircle(cx, cy, r, SSD1306_WHITE);
  float t = (float)constrain(value, 0, maxV) / (float)maxV;
  float ang = 3.14159265f * (1.0f - t);
  int x2 = cx + (int)((r - 6) * cos(ang));
  int y2 = cy - (int)((r - 6) * sin(ang));
  display.drawLine(cx, cy, x2, y2, SSD1306_WHITE);
  display.fillCircle(cx, cy, 2, SSD1306_WHITE);
}

unsigned long lastDraw = 0;
int tempC = 24;
int loadPct = 10;

void setup() {
  if (!display.begin(SSD1306_SWITCHCAPVCC, 0x3C)) for (;;);
}

void loop() {
  // fake sensor motion
  tempC = 20 + (millis() / 500) % 15;
  loadPct = 10 + (int)(40 + 40 * sin(millis() / 400.0));

  if (millis() - lastDraw < 100) return; // 10 Hz UI
  lastDraw = millis();

  display.clearDisplay();

  // title
  display.setTextSize(1);
  display.setTextColor(SSD1306_WHITE);
  display.setCursor(0, 0);
  display.println(F("LAB DASHBOARD"));
  display.drawFastHLine(0, 9, 128, SSD1306_WHITE);

  // left: temperature number
  display.setCursor(0, 14);
  display.print(F("Temp"));
  display.setTextSize(2);
  display.setCursor(0, 26);
  display.print(tempC);
  display.setTextSize(1);
  display.print(F("C"));

  // right: gauge for load
  drawGauge(96, 36, 22, loadPct, 100);
  display.setCursor(82, 14);
  display.print(F("Load"));

  // bottom bars
  display.setCursor(0, 46);
  display.print(F("Heat"));
  drawBar(32, 46, 96, 8, tempC - 20, 15);

  display.setCursor(0, 56);
  display.print(F("CPU"));
  drawBar(32, 56, 96, 8, loadPct, 100);

  display.display();
}
Hooking up real sensors
- Potentiometer:
loadPct = map(analogRead(A0), 0, 1023, 0, 100); - Battery divider: you can reuse the math from battery OLED meter.
- DHT / BME: read every 2 s, and keep your UI at 10 Hz with the last known values.
- Current sensor: average 16 samples, as in the battery article, to calm your bar.
Multi-page dashboards
When one screen isn't enough, I combine this with the
OLED menu pattern: Main shows live bars;
Select opens a detail page with bigger digits. Keep each page's draw function separate
(drawPageLive(), drawPageDetail()) so you don't drown in flags.
Performance notes for your board
- On an Uno with an I2C SSD1306, you'll typically get 10-20 FPS for a UI, which is fine.
- Heavy
sin/cosper frame is OK for one gauge. If you add more, you'll want to cache the needle endpoints. - Don't allocate
Stringobjects every frame. Print withprint(value). - SPI OLEDs refresh faster, and your UI code stays the same. See SPI vs I2C.
Making your dashboard look "designed"
- Keep a consistent left margin (2-4 px).
- Add one horizontal rule under the title.
- Align your bar tracks to the same x, and you'll see the difference.
- Use the size-2 font only for your primary number.
- Leave a blank column, so your text doesn't collide with the gauge.
If you want decorative icons (battery, wifi, warning), export tiny bitmaps from the animation tool and
drawBitmap them in the title strip. I keep them 8×8 or 16×16.
Troubleshooting your UI bugs
- Flicker: you've got multiple
display()calls per loop. - Bar always full: your maxV is wrong, or you didn't constrain the value.
- Gauge needle inverted: your angle mapping is flipped. Swap the
1.0 - tterm. - Numbers tear: you're printing without clearing old digits. Call clearDisplay each frame, or wipe a rect.
FAQ
Can I animate the bar smoothly?
Yes. You approach the target with shown += (target - shown) / 4 each frame for a cheap ease.
Is this better than bitmaps for my dashboard?
For numbers and bars, yes. Bitmaps shine for logos and character animation. They're a poor fit for live values.
Will this fit on my Uno with a DHT library?
Usually yes, since UI code's small. Watch your SRAM if you also store animation frames.
How fast should my dashboard call display()?
Ten times a second is enough for bars and one needle. Gate the redraw with millis() at 100 ms. Calling display() after every GFX line is what makes your panel flicker. It isn't the bar math itself.
Why does my size-2 text collide with the gauge?
Size-2 glyphs are 12 by 16 pixels. A three-digit number needs about 36 pixels plus the unit. Keep the gauge center near x = 96 with radius 22 or less, and start the big number at x = 0 so the two regions don't share columns.
Do the same bars work on my ESP32 or ESP8266?
Yes. Your draw helpers stay the same. On ESP32, SDA is GPIO 21 and SCL is GPIO 22. On ESP8266 NodeMCU, SDA is D2 and SCL is D1. Only the ADC range changes: Uno analogRead is 0-1023, ESP32 is often 0-4095.
Worked example: a potentiometer bench panel you can copy
The simulated sine wave in the full sketch is useful for learning layout. A pot on A0 is better when you want to see whether the bar, the percent and the needle agree. On an Uno, wire a 10k potentiometer from 5V to GND and the wiper to A0. Your OLED SDA stays on A4 and SCL on A5. display.begin(SSD1306_SWITCHCAPVCC, 0x3C) matches the usual SSD1306 address. Don't power an ESP32 or ESP8266 OLED from 5V. Those boards use 3.3V, with SDA on GPIO 21 and SCL on GPIO 22 for a typical ESP32, or D2 and D1 on a NodeMCU.
Read the pin once per UI tick and derive every widget from that one number. analogRead on an Uno returns 0-1023. Convert it with integer math, so a 16-bit multiply can't overflow before the divide. Here's the line:
int readPct() {
  int raw = analogRead(A0);                 // Uno: 0..1023
  return (int)((long)raw * 100L / 1023L);   // 0..100
}
On an ESP32, divide by 4095 instead of 1023 if you're using the default 12-bit ADC. The ESP8266 has a single ADC pin with a much smaller voltage range, so don't copy your Uno pot wiring onto a NodeMCU without a divider.
Place three views of pct on the 128×64 glass so nothing overlaps. Here's the layout I use:
- Title row, y = 0: you put the word
BENCHat the left at the left and print the raw ADC at cursor x = 72. - Big percent, y = 18, text size 2, x = 0. Three digits are about 36 pixels wide, so they're done well before the gauge starts.
- Needle gauge centered at (100, 32) with radius 18. The circle then occupies roughly x 82-118 and y 14-50, so it's inside the panel.
- Full-scale bar at y = 48, x = 28, width 96, height 8. I pass it the value
pct, max 100. - Upper-half bar at y = 58. Treat anything under 50 as empty:
hi = pct < 50 ? 0 : pct - 50with max 50. That bar stays dark until you turn the pot past mid-scale. It's a handy way to show a threshold.
Paint order is clearDisplay, title, number, drawGauge, both drawBar calls, then a single display(). Wrap that block so it runs only when millis() - lastDraw >= 100. A delay(100) would pace the screen too, but it blocks the next sample and any button you add later.
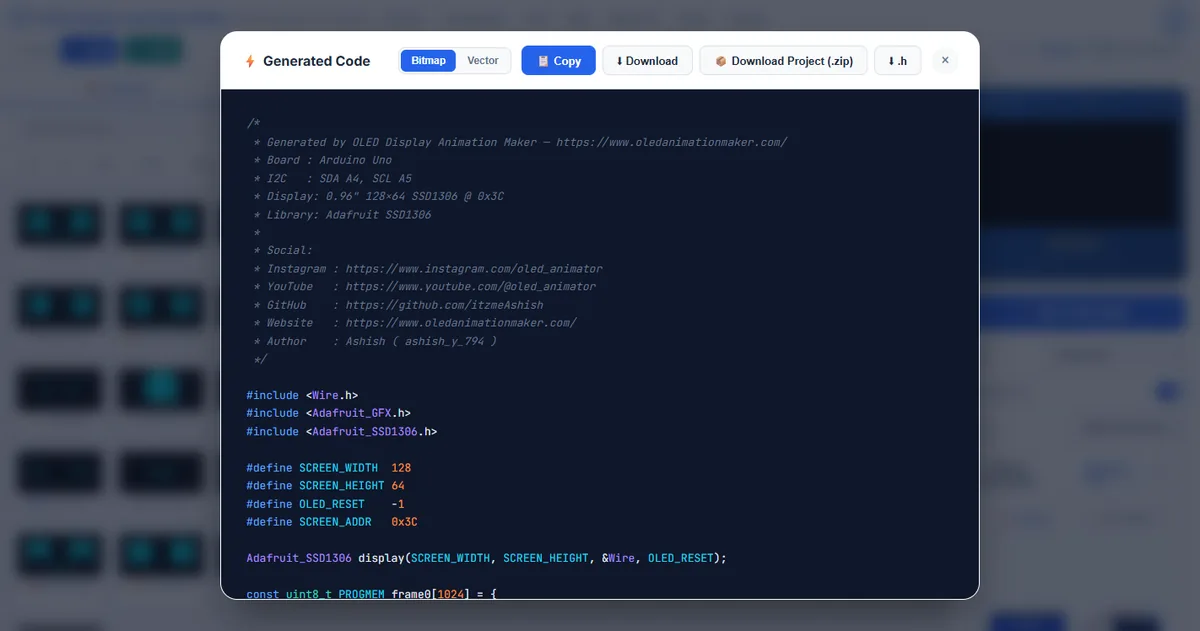
A full 128×64 buffer is 1024 bytes, and Adafruit's library already owns that buffer. This dashboard doesn't store extra frames. GFX draws into the buffer and display() ships it over I2C. Ten updates a second feel smooth to me, and that's plenty. Bitmap icons in the title strip are what eat your flash later, not the bars.
Integer fill, so your bar never overshoots
The helper already clamps value and uses a long multiply. Two extra checks stop the classic "bar pokes out of the frame" bug, and I'd keep both. Inner width is w - 4, since you've got a 1-pixel border plus a 1-pixel pad on each side. If fill comes back larger than that inner width, cap it. If h is under 4, skip the fill. A 2-pixel-tall track has no room for h - 4.
int inner = w - 4;
if (inner < 1 || h < 4) return;
int fill = (int)((long)value * inner / maxV);
if (fill > inner) fill = inner;
if (fill > 0) display.fillRect(x + 2, y + 2, fill, h - 4, SSD1306_WHITE);
Draw the outline after the fill if you'd like the border to stay crisp on top of a full bar. You can draw it first too, because the fill's inset by 2 pixels and doesn't cover the stroke.
When your bench panel still looks wrong
- Bar stuck at full width. You passed the raw 0-1023 reading into
drawBarwith amaxVof 100. Printpctonce a second and compare it with the track. - Needle leaves the circle. A center of 96 plus a radius of 30 reaches x = 126, and the outline needs a pixel of margin. Keep
cx + r < 127andcy + r < 63, and you're safe. - Old digits remain beside the new ones. A size-2 "9" is narrower than "100". Clear the whole frame each tick, or
fillRectthe number box in black before you print. - Black screen, code looks fine. Confirm
0x3C. If your scanner reports0x3D, change only that argument. Swapped A4 and A5 on an Uno looks the same as a wrong address. - UI freezes during a sensor read. A blocking DHT call can take tens of milliseconds. Store the last good reading, and let your 100 ms painter keep using it.
- Only the bottom bar flickers. You left
display()insidedrawBar. Remove it. One transfer at the end of the frame is the rule.
Related guides you might like
Add icons to your dashboard header
Sketch 8×8 status glyphs in the free tool, then drop them beside your title text.
Open oledanimationmaker.com →Free tools: OLED Animation Maker for your SSD1306 and SH1106 animations, Assemble Studio for your name and logo animations, and the Shadow Box Lamp Generator for your 3D-printed shadow lamps. See all tools.